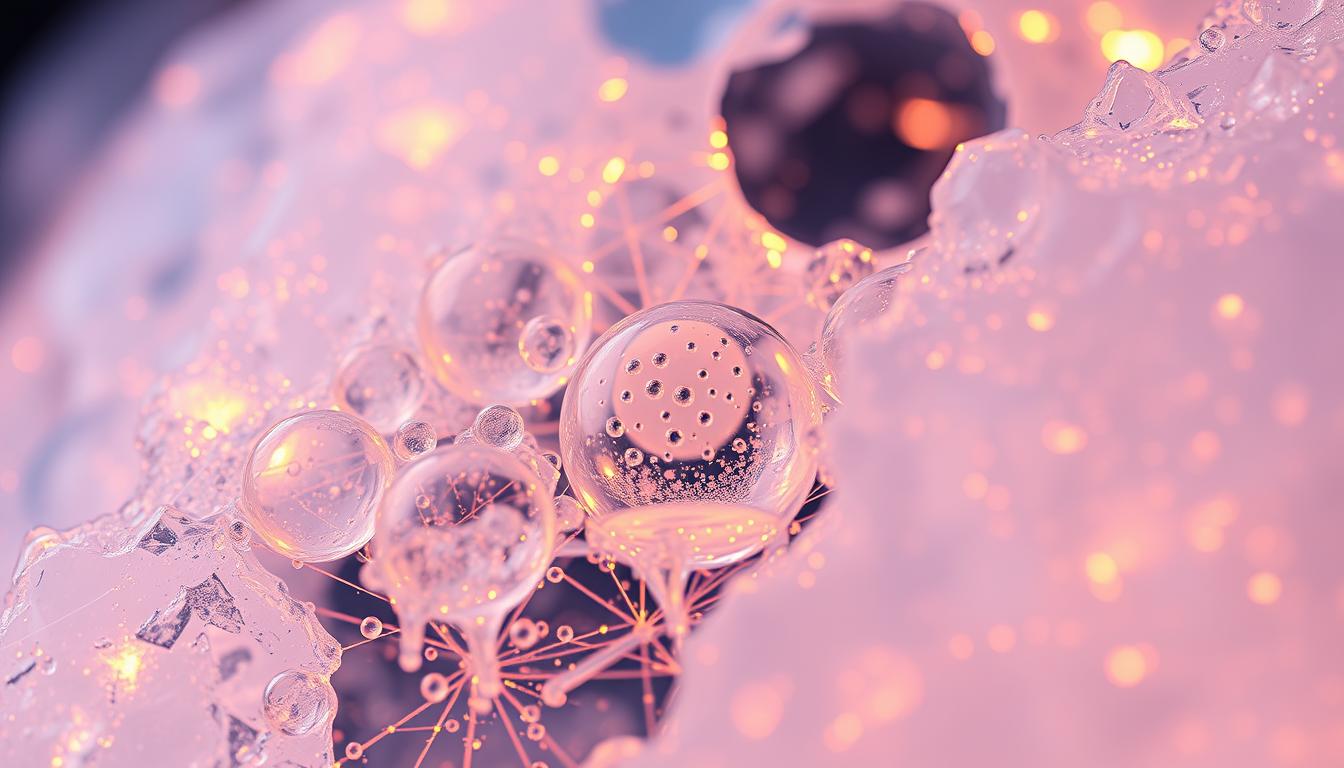
Every single ice crystal floating in your drink contains enough trapped gas to fill a balloon the size of your thumbnail. This occurs because water performs a molecular magic trick during freezing – expanding by 9% while locking atmospheric gases in intricate lattice patterns.
As temperatures drop to 32°F, H2O molecules transition from chaotic motion to organized hexagonal arrangements. These crystalline structures reject dissolved gases like nitrogen and oxygen, forcing them into visible pockets. The expansion during phase change creates density variations that make solid water float – a unique property critical to Earth’s ecosystems.
This natural process follows precise physical laws governing gas solubility and molecular bonding. Commercial ice manufacturers actually manipulate freezing rates to control bubble distribution, proving these formations aren’t random accidents but predictable results of thermodynamic principles.
Key Takeaways
- Water molecules form hexagonal structures when freezing begins at 32°F
- Dissolved gases get expelled during crystallization
- Density changes cause expansion and buoyancy
- Freezing speed directly impacts bubble size
- Gas solubility decreases dramatically in solids
Understanding the Science Behind Ice Cube Formation
Water transforms from liquid to solid through precise molecular teamwork. At 212°F, molecules escape as vapor, but below 32°F, they lock into organized patterns. This shift creates the foundation for crystal growth and gas expulsion.

Molecular Motion and Phase Changes
Heat determines water’s behavior. Warmer temperatures make molecules zip around freely. As temperature drops, movement slows. Hydrogen bonds start connecting molecules like puzzle pieces. Once 32°F hits, these bonds form a rigid hexagonal grid.
| State | Molecular Speed | Bond Strength |
|---|---|---|
| Liquid | Fast-moving | Weak bonds |
| Solid | Fixed positions | Strong bonds |
Crystal Architecture
The freezing process builds six-sided shapes naturally. These honeycomb patterns push out impurities and gases. Only pure H2O molecules fit into the growing structure, creating zones of clarity and trapped pockets.
Slow freezing allows larger crystals to form. Rapid cooling makes smaller, more chaotic arrangements. This explains why lake ice often appears clearer than freezer-made cubes.
The Process of Air Bubble Entrapment in Ice
Solidifying water acts like a molecular filter, sorting pure crystals from dissolved substances. As temperatures plummet, gases face expulsion from the growing lattice. This rejection creates pressure zones where gas clusters morph into permanent fixtures within frozen structures.

Impact of Rapid Versus Slow Freezing
Speed matters when trapping gases. Quick cooling locks dissolved substances in place before they escape. You’ll notice this in homemade cubes – faster freezing yields cloudy centers packed with microscopic pockets.
Slower solidification gives gases time to migrate outward. This creates clearer edges but leaves larger voids near the core. Research confirms bubbles form at the freezing front, with sizes varying based on cooling rates:
| Freezing Speed | Bubble Size | Quantity | Gas Escape |
|---|---|---|---|
| Rapid | 0.01-0.1mm | High | Limited |
| Slow | 0.5-2mm | Low | Significant |
Pressure changes during solidification force gas pockets into elongated shapes. Once surrounded by ice, these formations become permanent records of the freezing process. Commercial producers manipulate cooling rates to achieve specific bubble patterns – proof that these features follow predictable physical laws.
Capillary forces at the gas-liquid boundary further influence bubble geometry. Unlike spherical soap bubbles, frozen gas pockets stretch along temperature gradients. This directional growth leaves distinct signatures visible under magnification.
Directional Freezing and Its Impact on Ice Clarity
Crystal-clear frozen formations reveal nature’s mastery of organized cooling. When solidification occurs in one primary direction, it creates a purification system that pushes imperfections away from the growing ice front.

Nature’s Ice-Making Laboratory
Northern lakes demonstrate perfect directional freezing each winter. Surface water chills first, forming transparent layers as contaminants sink into liquid below. This self-cleaning process leaves the upper strata bubble-free, while dissolved minerals concentrate near the bottom.
Home freezers work differently. Cubes solidify from all sides simultaneously, creating a battlefront where impurities collide. Calcium and magnesium particles get trapped mid-cube, forming cloudy cores. This explains why lake surfaces often gleam like glass, while your drink’s cubes resemble frosted windows.
The Impurity Paradox
Tap water contains minerals that sabotage transparency. During multi-directional freezing, these substances have nowhere to escape. The converging freeze fronts create a central collection point for:
- Dissolved gases
- Calcium carbonate
- Magnesium ions
Commercial producers mimic lake conditions using specialized equipment. Their machines chill water from top to bottom, replicating nature’s purification method. This controlled approach yields restaurant-quality clear ice with minimal bubbles.
| Freezing Type | Clarity Level | Bubble Density |
|---|---|---|
| Directional (lake) | High | Low |
| Multi-directional (freezer) | Low | High |
Examining the Physics: Heat Transfer and Capillarity
The formation of frozen water involves a delicate balance between thermal energy and molecular forces. Two key principles determine gas entrapment patterns: heat redistribution during phase changes and capillary action at microscopic scales.

The Stefan Condition Explained
Heat flow dictates freezing speed through the Stefan condition: Ji + Jw + Ja = ρiLfv. This equation balances heat from three sources – existing ice (Ji), surrounding water (Jw), and air (Ja) – against ice density (ρi), latent heat (Lf), and freezing velocity (v). Since air contributes minimal energy, the equation simplifies to directional freezing perpendicular to gas pockets.
| Variable | Meaning | Role |
|---|---|---|
| Ji | Ice heat flux | Maintains crystal growth |
| ρiLfv | Phase change energy | Drives solidification rate |
| v | Freezing velocity | Determines bubble angles |
Capillary Forces and Freezing Dynamics
Surface tension (75 mN/m at 0°C) creates pressure differences across gas-liquid boundaries. These forces squeeze bubbles into teardrop shapes as ice advances. The 90° contact angle between ice and gas pockets emerges from energy minimization – nature’s way of balancing thermal gradients with molecular attraction forces.
Temperature Effects on Ice Structure
Cooling rates influence bubble distribution through convection currents. Rapid chilling creates chaotic flows that trap gases randomly. Gradual freezing allows orderly gas migration, producing layered patterns. This explains why commercial ice makers control temperature gradients precisely to achieve desired clarity levels.
| Freezing Rate | Bubble Shape | Surface Interaction |
|---|---|---|
| Fast | Irregular spheres | High pressure differentials |
| Slow | Elongated forms | Balanced capillary action |
How Ice Cubes Trap Air Bubbles
When water solidifies, dissolved gases become actors in a microscopic drama. The process follows strict physical rules that dictate where and how pockets form. Scientists have mapped this sequence using high-speed cameras and mathematical models.

Scientific Principles of Bubble Entrainment
Nucleation begins where cooling meets resistance. At the freezing front, gas concentration spikes to 140% of normal levels. This supersaturation forces molecules to cluster into embryonic pockets. Research shows these events last under two seconds but leave permanent marks.
The Epstein-Plesset equation reveals why growth stalls. As ice surrounds a pocket, gas diffusion slows dramatically. Final shapes depend on timing – early-trapped bubbles stretch into teardrops, while latecomers remain spherical. A typical cavity measures 0.15mm long and 0.06mm wide.
- Supersaturation triggers gas aggregation at phase boundaries
- Radial expansion continues until ice walls isolate the pocket
- Diffusion coefficients control gas migration speed
Mass transfer follows j=D(c₀-cᴿ)(1/R+1/√πDt). This formula explains why colder water produces smaller cavities. The concentration gradient (c₀-cᴿ) shrinks as temperatures drop, limiting bubble dimensions.
“Freezing transforms liquid water into a gas-filtering machine – every bubble tells the story of its capture.”
Techniques for Producing Clear Ice at Home and Commercially
Crafting transparent frozen water requires mastering three elements: purity, temperature control, and directional solidification. Whether creating artisanal spheres for cocktails or industrial blocks, these principles separate cloudy formations from glass-like results.

DIY Methods for Clear Ice
Start with purified water. Boiling removes dissolved gases, while distillation eliminates minerals. Use insulated containers to slow freezing – a small cooler works perfectly. The insulation forces solidification downward, pushing impurities into unfrozen water below.
Cutting matters. After 18-24 hours, remove your ice block. Trim cloudy sections with a serrated knife, keeping only the clearest center. For consistent shapes, silicone molds with directional freezing compartments simplify the process.
Commercial Ice Machine Innovations
Industrial producers use multi-stage filtration. Reverse osmosis systems strip water of 99% minerals before freezing. Advanced machines circulate chilled liquid across freezing plates, creating uniform clarity. The process yields 300-pound blocks later carved with laser-guided saws.
| Method | Time Investment | Clarity Level | Cost per Cube |
|---|---|---|---|
| Home DIY | 24+ hours | 85-90% | $0.12 |
| Commercial | 3 hours | 98% | $0.03 |
Customization thrives in commercial settings. Freezing stages allow embedding edible flowers or logos. While home methods work for occasional use, businesses benefit from industrial efficiency – one machine produces 2,000 clear ice cubes hourly with restaurant-grade consistency.
Analyzing Experimental Procedures and Results
Laboratory investigations reveal critical patterns in how solidifying water captures gases. Researchers employ Hele-Shaw cells – transparent chambers enabling precise observation – to study bubble formation under controlled conditions. These experiments track phase changes at microscopic levels, mapping gas behavior during solidification.
Observational Insights from Freezing Experiments
Studies demonstrate freezing speed dramatically alters cavity development. At 263 μm/s, rapid solidification traps hundreds of tiny pockets averaging 53μm in length. Slower rates (46 μm/s) produce fewer cavities measuring 200μm long. The table below shows key findings:
| Freezing Rate | Bubble Length | Bubble Width | Quantity |
|---|---|---|---|
| 263 μm/s | 53μm | 36μm | High |
| 46 μm/s | 200μm | 96μm | Low |
Data on Air Bubble Distribution
Nucleation timing proves crucial. When gas pockets form 100μm from the freezing front, they develop elongated shapes due to extended growth periods. Closer nucleation (35μm) results in spherical formations. Aspect ratios shift from 1.5:1 to 2.2:1 based on these distances.
Controlled studies validate theoretical models. The Epstein-Plesset equation accurately predicts bubble expansion limits during solidification. This data helps manufacturers optimize freezing parameters for desired clarity and strength in commercial products.
Advanced Studies on Ice Porosity and Bubble Dynamics
Cutting-edge research reveals fresh insights into frozen water’s hidden architecture. Scientists now track gas movement through ice using advanced imaging techniques, uncovering patterns invisible to earlier generations.
Recent Research Findings and Model Analysis
X-ray tomography exposes intricate bubble networks shaped by cooling speeds. Studies show slower solidification creates fewer but larger cavities, while rapid freezing traps clusters of micro-pockets. These discoveries validate mathematical models predicting gas behavior during phase transitions.
New 3D simulations map pressure gradients within freezing water. The models explain why bubbles align along temperature fronts in commercial ice production. Recent experiments with Arctic ice cores demonstrate how ancient atmospheric conditions get preserved in frozen gas pockets.
Material scientists now engineer ice with controlled porosity for medical applications. Custom freezing patterns enable precise drug delivery systems. These breakthroughs highlight nature’s frozen designs as blueprints for future technologies.


